Why I Dropped My Ad Position from 1.9 to 2.7
I lowered bids on a core domestic route, dropping average ad position from 1.9 to 2.7 with only a 4% loss in impression share. Testing how much free brand search automated targeting actually cannibalizes.

Every search campaign starts with the same comfortable assumption. Buy the maximum available intent on the route.
It sounds reasonable. Take a mature, year-round domestic route between a major regional hub and a capital city. Flights operate daily, schedules are predictable, and brand recognition in that region is near universal. To capture every possible passenger, the campaign runs at full throttle. The performance dashboard proudly reports an average ad position hovering around 1.9.
The agency reliably reports that we dominate top-of-page results, impression share stays comfortably above 90%, bookings keep rolling in, and acquisition costs look fine.
That is where algorithmic self-deception begins.
When managing significant ad budgets, you spend less time competing with other airlines and far more time fighting the platform's own greed. Google Ads optimization systems have one primary mandate, deliver reported conversions at all costs. When you demand maximum volume on a specific route, automated targeting starts scraping everything in sight. Even after rigorous search query clustering and extensive negative keyword lists covering the airline name, the algorithm discovers every workaround. Misspellings, airport codes, conversational brand queries, and vague regional phrases.
The ad system intercepts users who already intended to buy a ticket from that exact carrier, then sells those passengers back to the company at the highest possible top-of-page cost. On paper it looks like flawless execution. In reality the campaign simply cannibalizes our own free organic search.
I decided to run an empirical test to challenge this loop.
First, SEO secured the foundation. Over several months, the search team locked down organic visibility in the departure market. We cleaned up route landing pages, restructured flight schedules, and captured primary search intent. The website secured the absolute top organic ranking.
Then I made the adjustment that makes media buyers deeply uncomfortable.
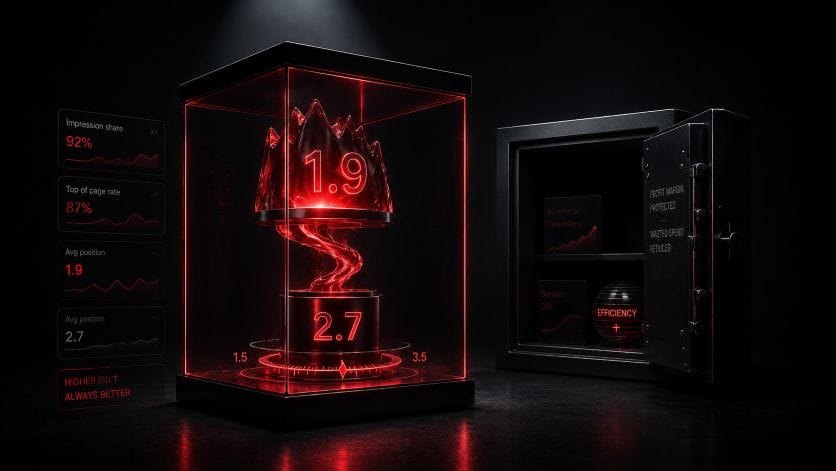
I reduced bids and let the average ad position slide from 1.9 down to roughly 2.7.
Total impression share barely moved, dropping from 90.2% to 86%. We sacrificed only four percent of reach. The ad still appears above organic listings, but it stepped out of the aggressive first-touch click zone.
| Metric | Aggressive Bidding | Controlled Position | Delta |
| Average Position | 1.9 (Top Slot) | 2.7 (Lower Premium) | -0.8 |
| Impression Share | 90.2% | 86.0% | -4.2% |
| Target Traffic Type | Brand + Route Intent | Pure Route Intent | Filtered Brand |
| Device Priority | Mixed First-Click | Desktop Checkout Focus | High Intent |
The mechanics behind this decision are straightforward.
Roughly 65% of route traffic arrives via mobile devices, but over 70% of completed flight bookings still happen on desktop. Passengers browse schedules on the go, but when it comes to entering passport data and paying, they sit down in front of a monitor. On a desktop screen, the entire search results page is visible at once. A user looking specifically for our flight easily spots the top organic link and clicks it for free. Meanwhile, sitting at position 2.7, our paid ad continues to capture uncommitted users searching for generic route options.
The final financial and web analytics data will be ready in thirty days. The test is running right now.
Only two outcomes are possible.
Either total booking volume on the route remains completely flat, proving that paying for position 1.9 was merely a tax on algorithmic capture. Or seat sales show a measurable decline, giving us the genuine, unvarnished cost of that incremental passenger from the absolute top spot.
In a month, I will pull the revenue numbers and see what that top ad position was actually worth.